A1.2.5
Construct logic diagrams
A logic diagram is a visual representation of a logical expression using gate symbols. Shows: inputs, gates used, order of operations, final output.
- A logic diagram is a visual representation of a logical expression using gate symbols.
- Shows: inputs, gates used, order of operations, final output.
Basic method
- Identify the input variables.
- Identify the operations in the expression.
- Build the circuit in the correct order of operations.
- Connect the final output.
Example 1
Q = A AND B
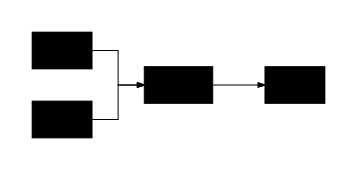 A visual trace of the relationships described in this objective.
Example 2
Q = (A AND B) OR C
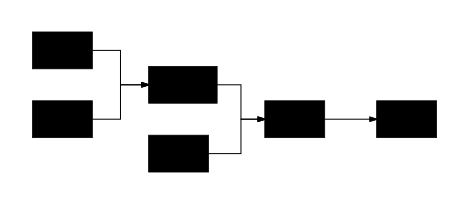 A visual trace of the relationships described in this objective.
Example 3
Q = NOT (A OR B) — equivalent to a NOR gate.
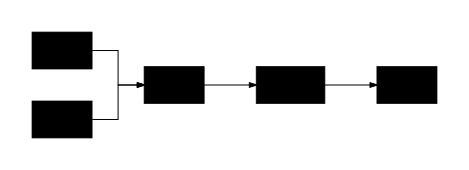 A visual trace of the relationships described in this objective.
How to analyse a logic diagram
- Start from the inputs.
- Follow the signal through each gate in order.
- Work out the intermediate outputs.
- Determine the final output.
Converting between expressions, truth tables, and diagrams
- Expression → diagram: turn each operation into the correct gate.
- Diagram → truth table: test every input combination.
- Truth table → expression: identify when output is
1and build the corresponding rule.
Common mistakes
- Mixing up
ORandXOR. - Forgetting
NOTchanges the input before the next operation. - Evaluating gates in the wrong order.
- Forgetting NAND = NOT(AND) and NOR = NOT(OR).